
 Apartments
 Villas
 Townhouses
 Penthouses
 Commercial
 See All Properties
Signature Collection
Explore Signature Commercial
 Property Management
 List Your Property
 Mortgages
 Conveyancing
 Short Term Rentals
 Property Snagging
 Partner Program
 Currency Exchange
 PRYPCO
 Ethnovate
 Plots
Plots
Dubai's residential property market maintained its growth momentum through the first half of 2026, with sustained demand across both off-plan and secondary segments driving transaction activity and average prices higher.
Stay ahead of Dubai's fast-moving property market with the Provident Dubai Real Estate Market Report for H1 2026. Whether you are an investor, end-user, developer or industry professional, this report covers the headline numbers, top-performing communities and capital flow shifts shaping the market.
DUBAI REAL ESTATE MARKET OVERVIEW - H1 2026
Dubai real estate market data from H1 2026 confirmed that both transaction activities and pricing hold firm despite a growing supply pipeline.
- Total Transactions: 49,401
- Total Sales Value: AED 182.9B
- Average Price: AED 3.7M per transaction
- Average Price per sq. ft: AED 1,770
- Increase in Price (2025 to 2026): 6.7% YoY
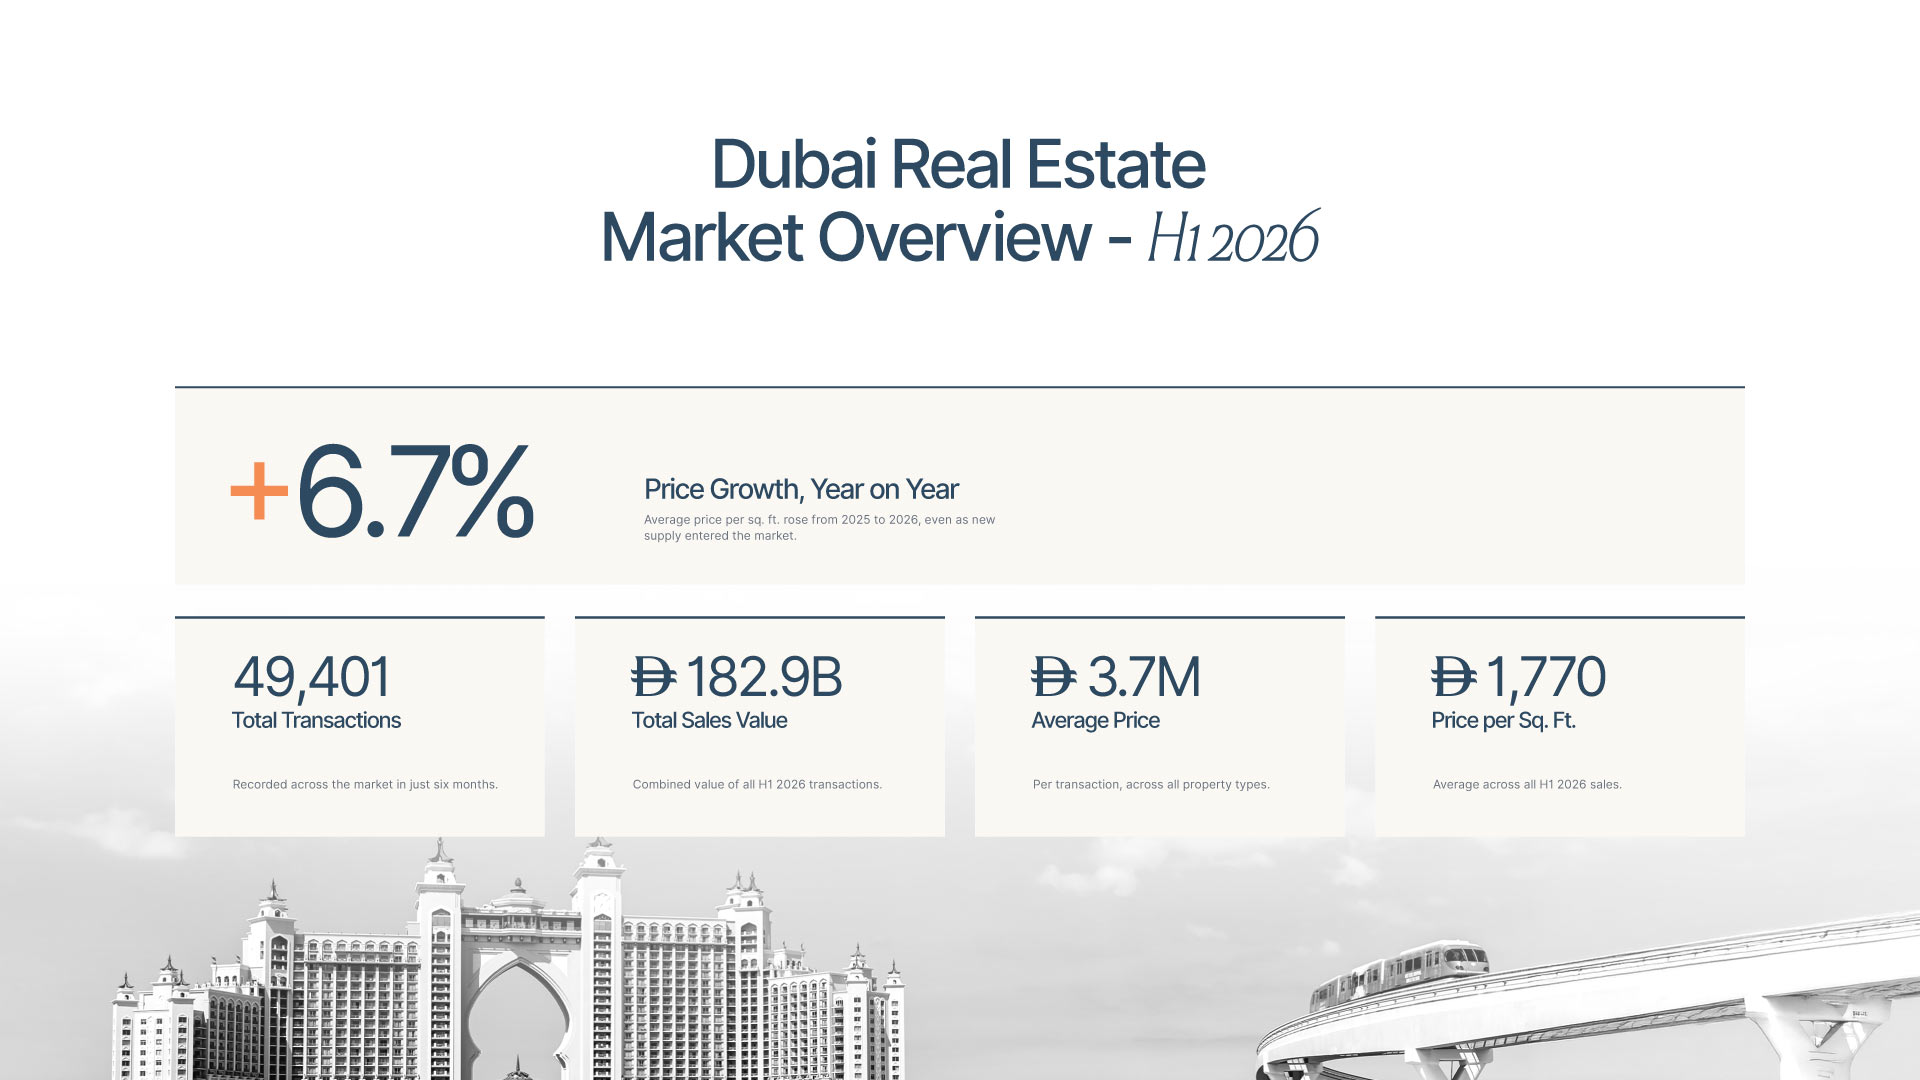
In the first half of 2026, Dubai’s real estate market observed a 6.7% year-on-year increase in average price per sq. ft., sustained across a market that recorded nearly 50,000 transactions in just six months. It reflects a demand base that is comfortably absorbing new supply without putting downward pressure on values.
Maintaining that balance is uncommon in markets with active pipelines. The H1 2026 data confirms that both end-user and investor demand remain strong enough to support continued price growth.
Transactions by Price Segment
Dubai's H1 2026 transaction data shows a market active across all price points, from entry-level units below AED 1 million to premium assets above AED 5 million.
- Below AED 1M: ~28.7%
- AED 1M–2M: ~32%
- AED 2M–3M: ~16.6%
- AED 3M–5M: ~11.5%
- Above AED 5M: ~11.2%
The transaction distribution across price segments reveals a market that is growing at both ends. The AED 1M to AED 2M band captured the largest share of activity at approximately 32%, confirming that the mid-market remains the volume driver of Dubai's residential sector.
However, the 11.2% share recorded above AED 5M is equally significant. It reflects premium and ultra-prime participation that few global property markets sustain alongside a healthy mid-market base.
The below AED 1M segment at 28.7% indicates continued accessibility at the entry level, supported by off-plan payment plans that allow buyers to enter the market at lower upfront prices.
Mortgage Market & Buyer Profile
Let’s decode the Dubai mortgage market and buyer profile from the first half of 2026.
| Metric | Value | YoY Change |
| Mortgage Transactions | 12,118 | -76.2% |
| Total Mortgage Value | AED 61.6B | -65.6% |
| Loan-to-Value (LTV) | 76.14% | +4.46% |
The year-on-year decline in both mortgage transactions and total mortgage value may appear counterintuitive in a growing market, but the rising loan-to-value ratio of 76.14% provides important context.
It shows that buyers are financing a larger proportion of each purchase, which indicates that mortgage activity is concentrating into fewer but higher-value deals rather than spreading across a broad base of transactions.
A higher LTV also reflects growing buyer confidence in long-term price appreciation.
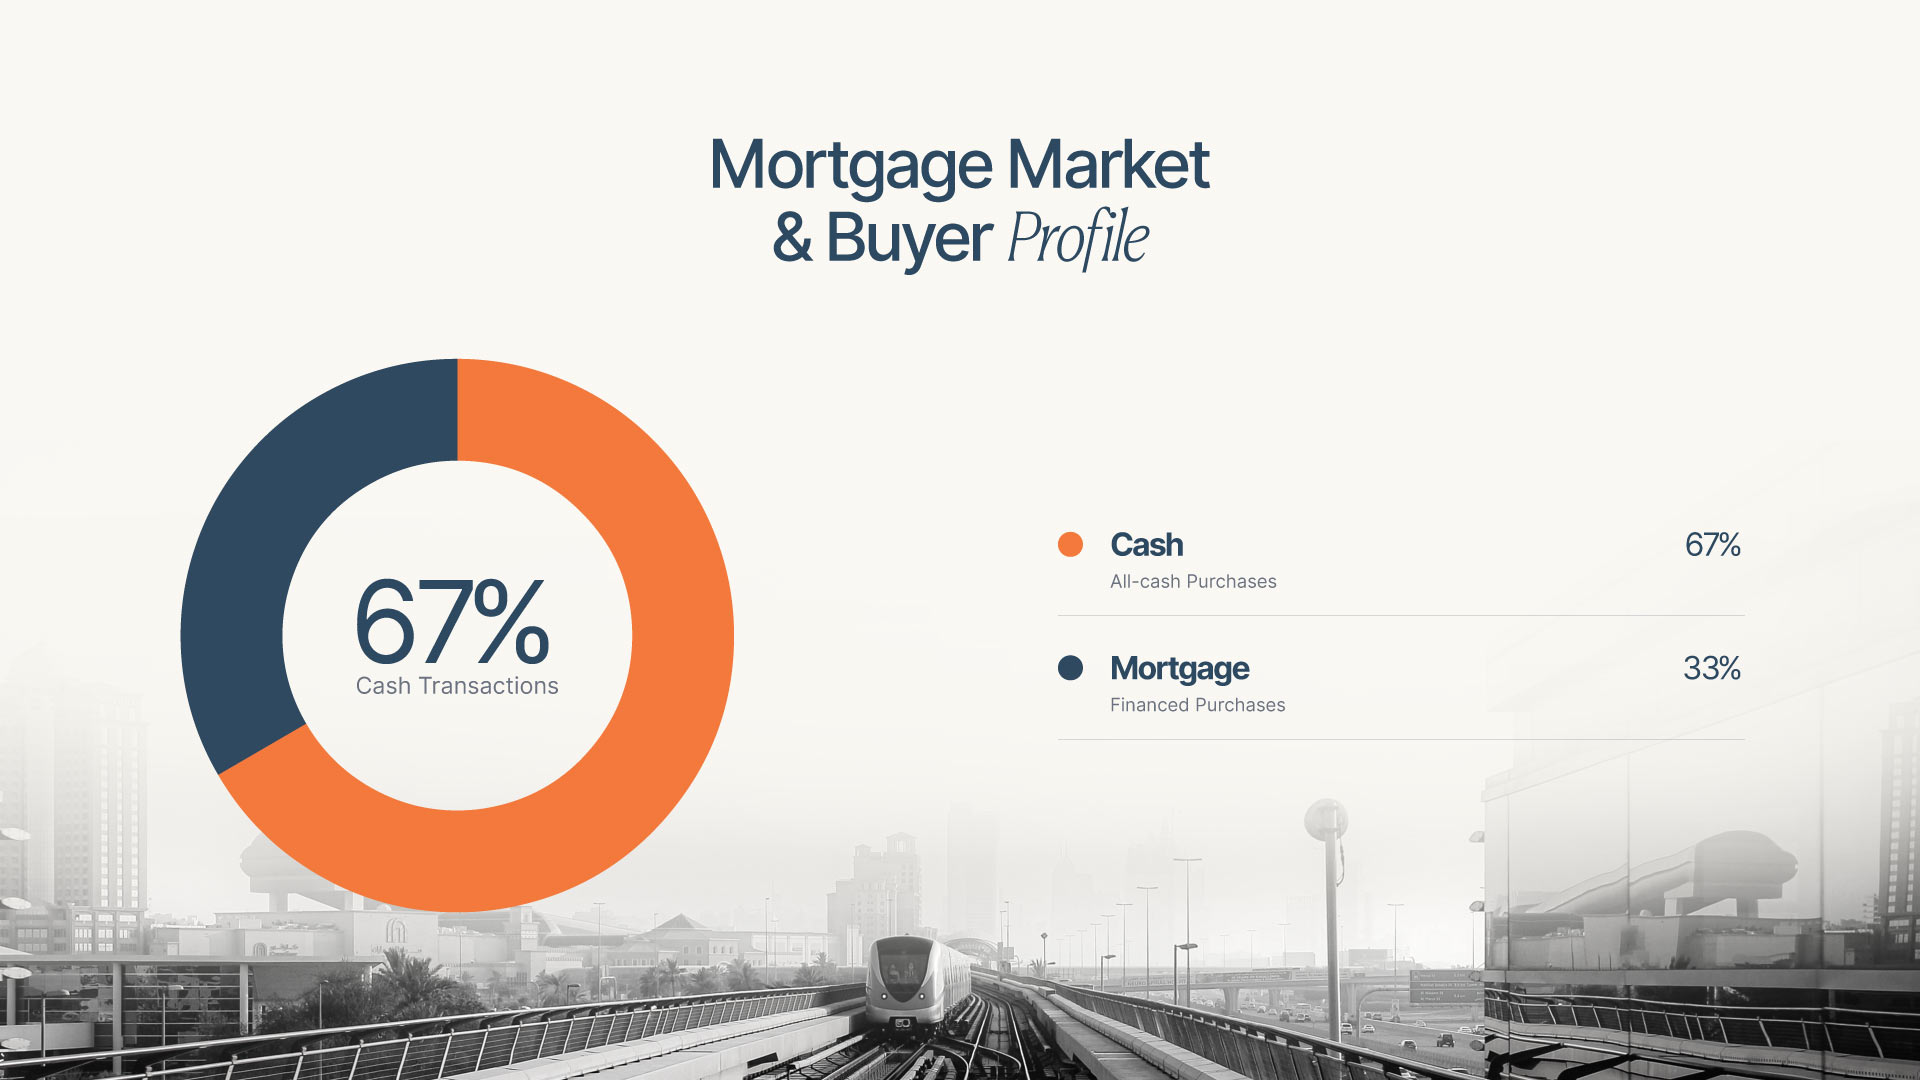
The table above shows that cash transactions dominated buyer activity in H1 2026, funding 67% of all residential purchases. Mortgage-backed transactions accounted for the remaining 33%, with 12,118 financed deals recorded at a combined value of AED 61.8B.

Unlock High ROI's on property
Invest Smart, Invest with Provident
Discover a World of Opportunities to Maximize ROI.
Residential Market: Off-Plan and Secondary
The table below compares full-year 2025 residential market performance against the first six months of 2026.
2026 figures reflect H1 only and are not directly comparable to the full-year 2025 data.
| Year | Total Sales Transactions | Sale Value | Average Sale Price | Average Price per Sq. Ft. |
| 2025 | 213,700 transactions | AED 681B | Avg. sale AED 3.2M | AED 1,600 |
| 2026 | 49,401 transactions | AED 182.9B | Avg. sale AED 3.7M | AED 1,770 |
Even with only six months of data, average prices in 2026 are already higher than the full-year 2025 average. Buyers paid AED 3.7M per property on average in H1 2026, compared to AED 3.2M across all of 2025.
The price per sq. ft. tells the same story, rising from AED 1,600 in 2025 to AED 1,770 in the first half of 2026. It highlights that the property in Dubai costs more per unit of space than it did a year ago, and demand has remained strong enough to sustain the increase in prices.
Secondary Market (Resale)
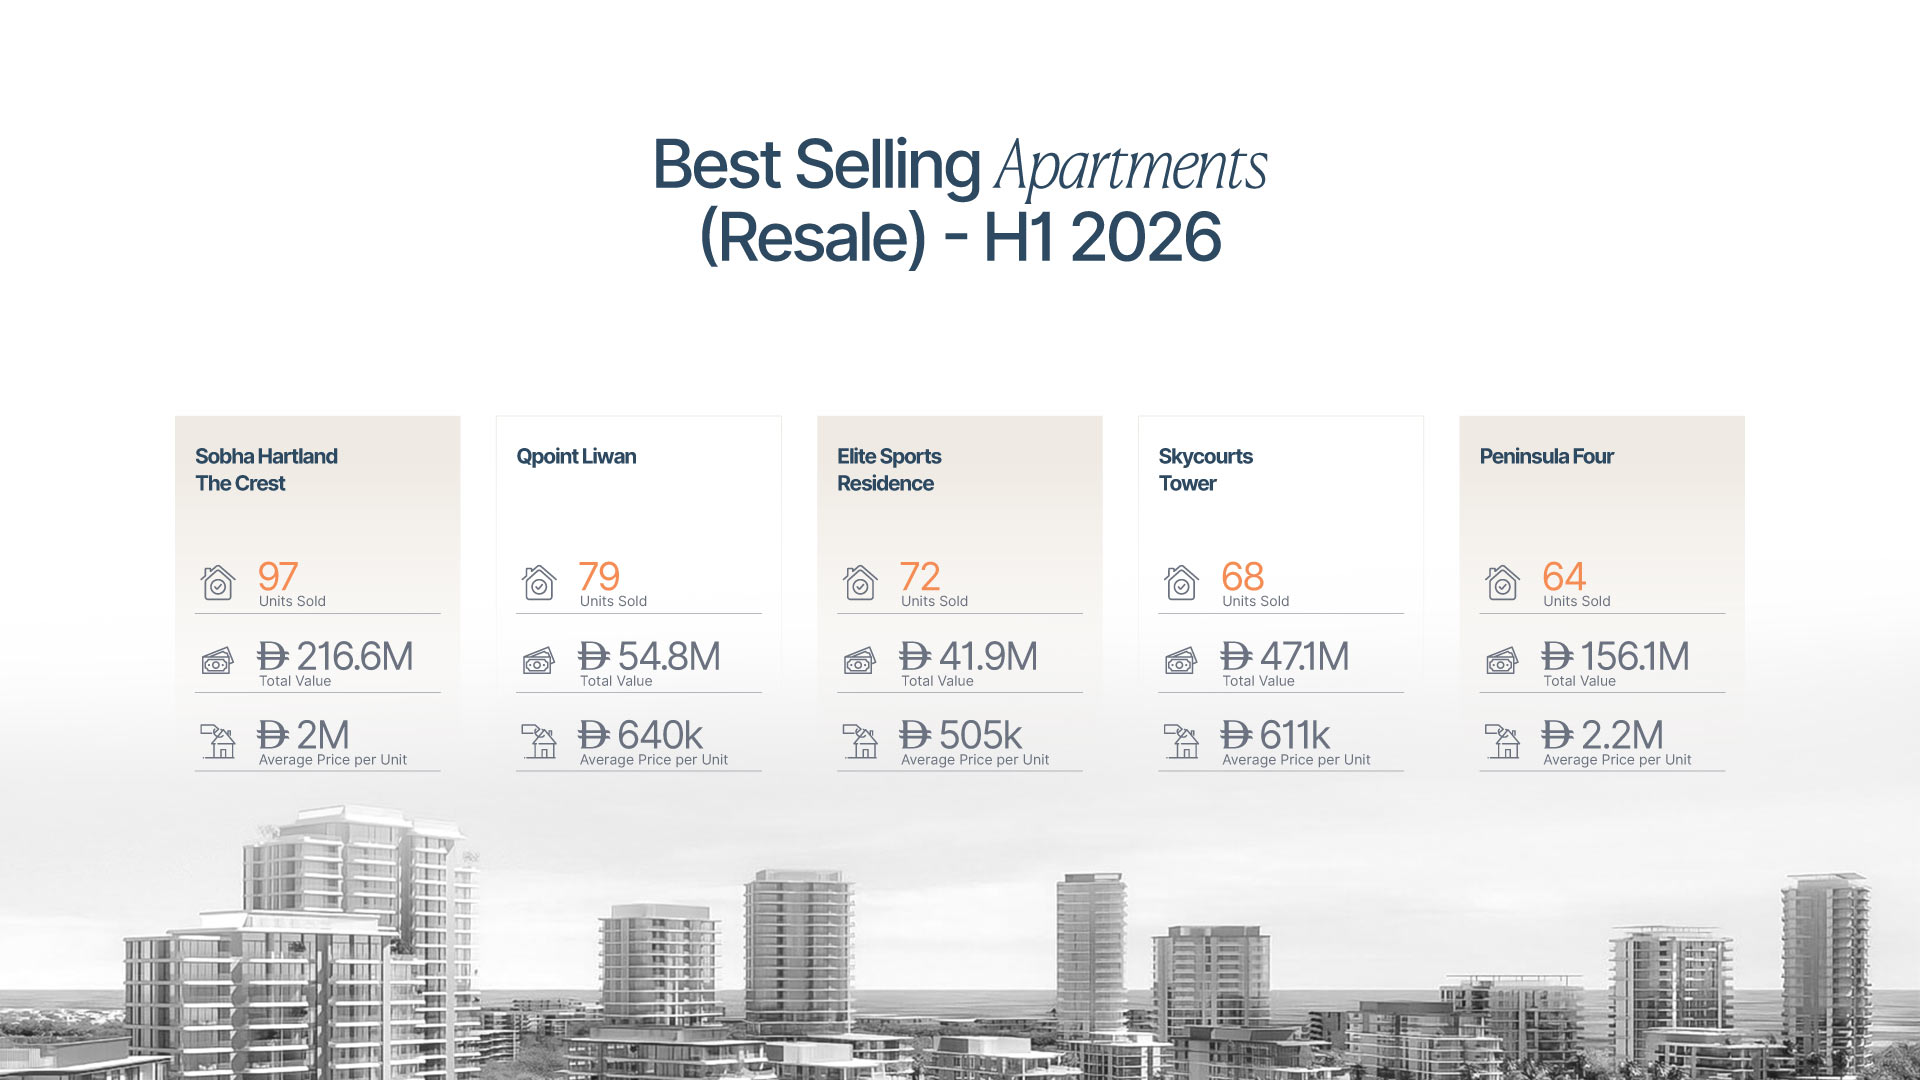
Dubai's secondary market held its ground in H1 2026, with apartments leading transaction volume and villas generating significantly higher average values per deal. Buyers in this segment were largely drawn to established communities offering ready properties, proven rental returns and immediate occupancy.
Apartments
The secondary apartment market recorded 10,672 transactions worth AED 21.1B in H1 2026. The average price is recorded at AED 1.3M, whereas the average price per sq. ft. is AED 1,570.
While off-plan properties often offer lower entry prices through developer payment plans, secondary apartments appeal to buyers who want a property they can move into or rent out immediately without waiting for construction to complete.
- Total Sold: 10,672
- Sales Value: AED 21.1B
- Average Price: AED 1.3M
- Average Price per sq. ft: AED 1,570
- Top Areas by Volume For Resale:
- Al Barsha South Fourth: 10.6%
- Business Bay: 8.5%
- Marsa Dubai: 7.9%
- Al Merkadh: 5.7%
- Downtown Dubai: 5.5%
Al Barsha South Fourth led secondary apartment transactions with 10.6% of total volume, followed by Business Bay at 8.5% and Marsa Dubai at 7.9%.
The concentration of activity in these three areas reflects sustained demand in communities that offer a combination of established infrastructure, strong transport links and consistent rental demand.
Al Merkadh and Downtown Dubai rounded out the top five, together accounting for a further 11.2% of secondary apartment volume.
Villas
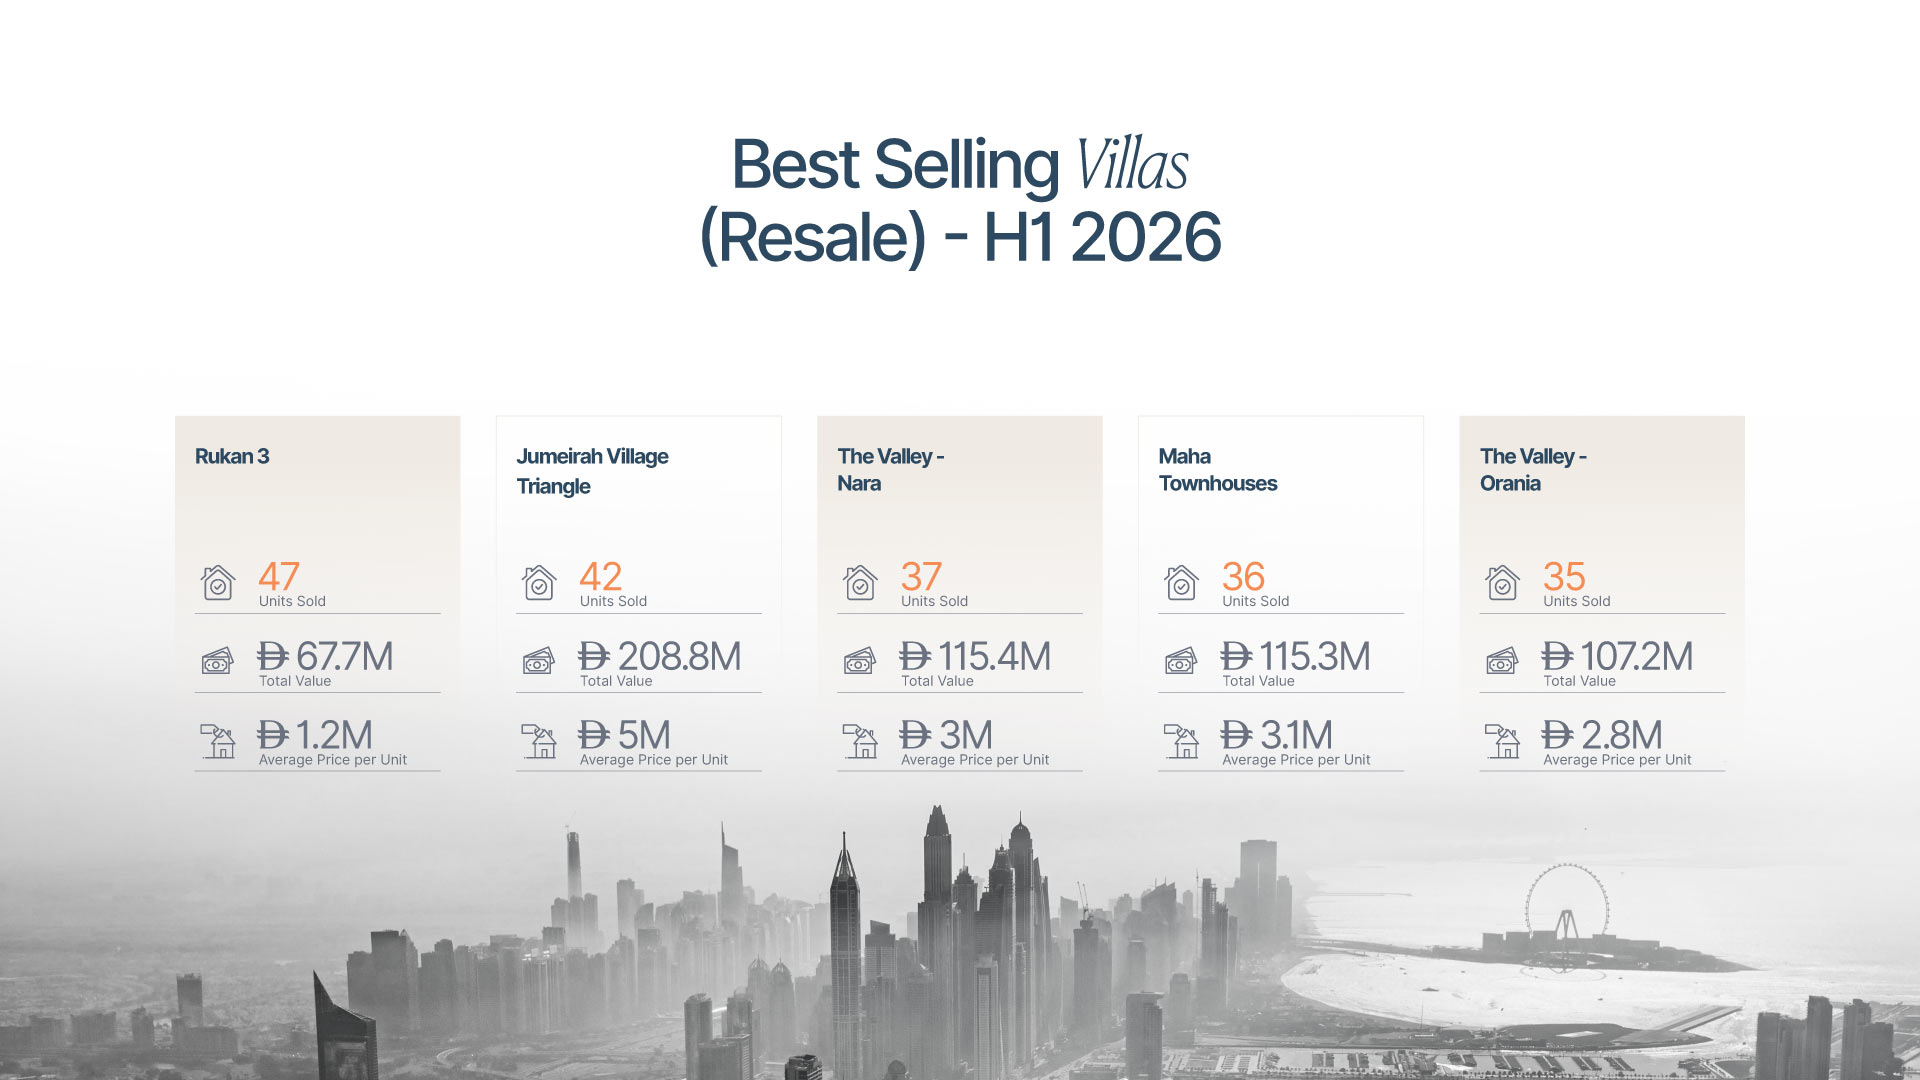
Secondary villa transactions totaled 2,604 in H1 2026, generating AED 18.5B in sales value at an average price of AED 4.1M per unit.
While villas recorded significantly fewer transactions than apartments, the average transaction value was three times higher, reflecting the premium that buyers place on larger, standalone family homes in established residential communities.
- Total Sold: 2,604
- Sales Value: AED 18.5B
- Average Price: AED 4.1M
- Average Price per sq. ft: AED 1,550
- Top Areas by Volume:
- Wadi Al Safa 5: 10.3%
- Al Hebiah Fifth: 9.2%
- Dubai South: 6.7%
- Al Yufrah 1: 6.6%
- Wadi Al Safa 7: 5.6%
Wadi Al Safa 5 and Al Hebiah Fifth together accounted for nearly 20% of all secondary villa transactions, indicating strong and consistent demand in these established villa communities.
Dubai South, Al Yufrah 1 and Wadi Al Safa 7 rounded out the top five, collectively representing a further 18.9% of volume and confirming that family-oriented suburban communities continue to attract steady buyer interest in the secondary market.
Off-Plan Market
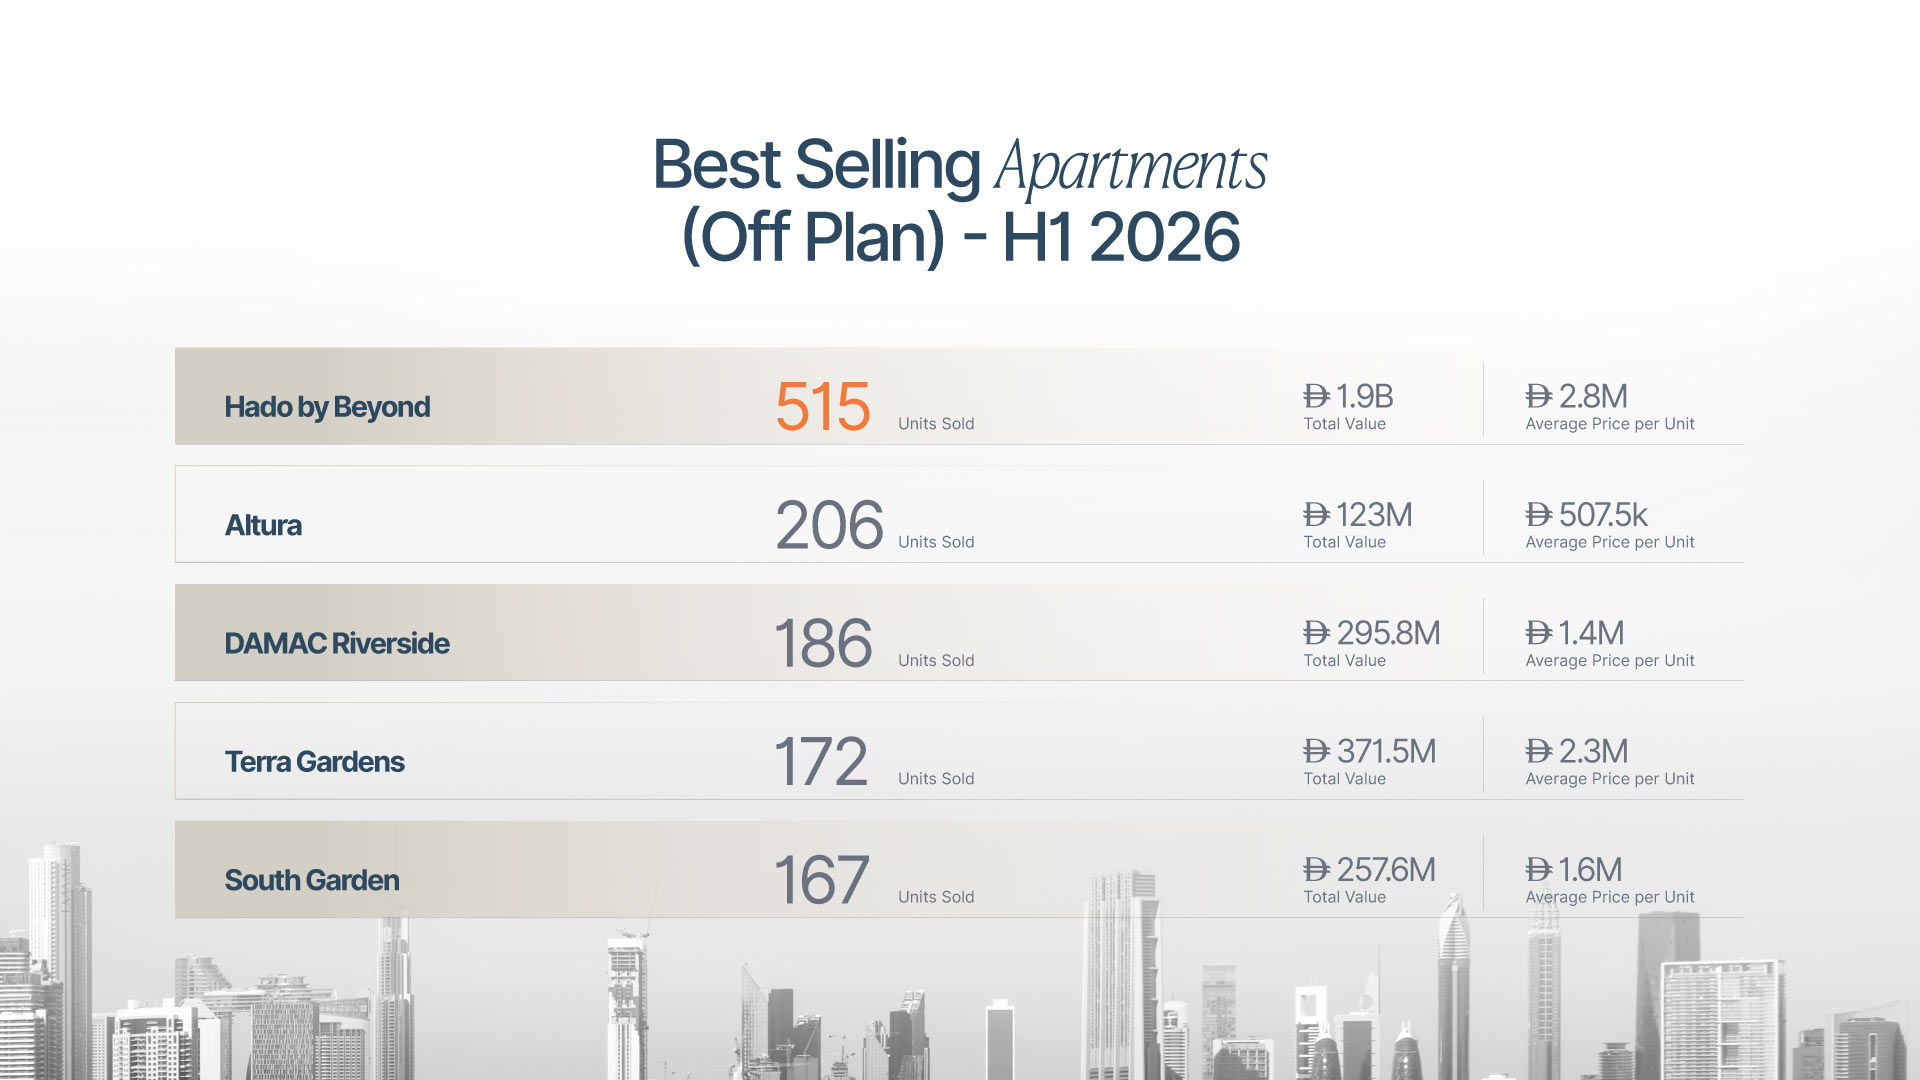
Dubai's off-plan market continued to account for the majority of residential transaction activity in H1 2026. It shows the willingness of buyers to invest in off-plan properties across all price points, drawn by flexible developer payment plans and the opportunity to enter an established market.
Apartments
- Total Sold: 26,948
- Sales Value: AED 56.8B
- Average Price: AED 1.3M
- Average Price per sq. ft: AED 1,760
- Top Areas by Volume:
- Dubai South: 9.2%
- Wadi Al Safa 5: 8%
- Al Barsha South Fourth: 7.2%
- Wadi Al Safa 3: 6.6%
- Dubai Islands: 6.3%
Dubai South led off-plan apartment activity with 9.2% of total volume, driven by the area's expanding residential supply and its appeal to buyers looking for competitively priced units within a large-scale master-planned development.
Wadi Al Safa 5 and Al Barsha South Fourth followed closely at 8% and 7.2% respectively, reflecting consistent demand in communities with strong connectivity and established amenities.
Dubai Islands at 6.3% is worth noting as a relatively newer neighborhood that has quickly established itself among the top five, reflecting strong demand for off-plan waterfront properties in Dubai.
Villas
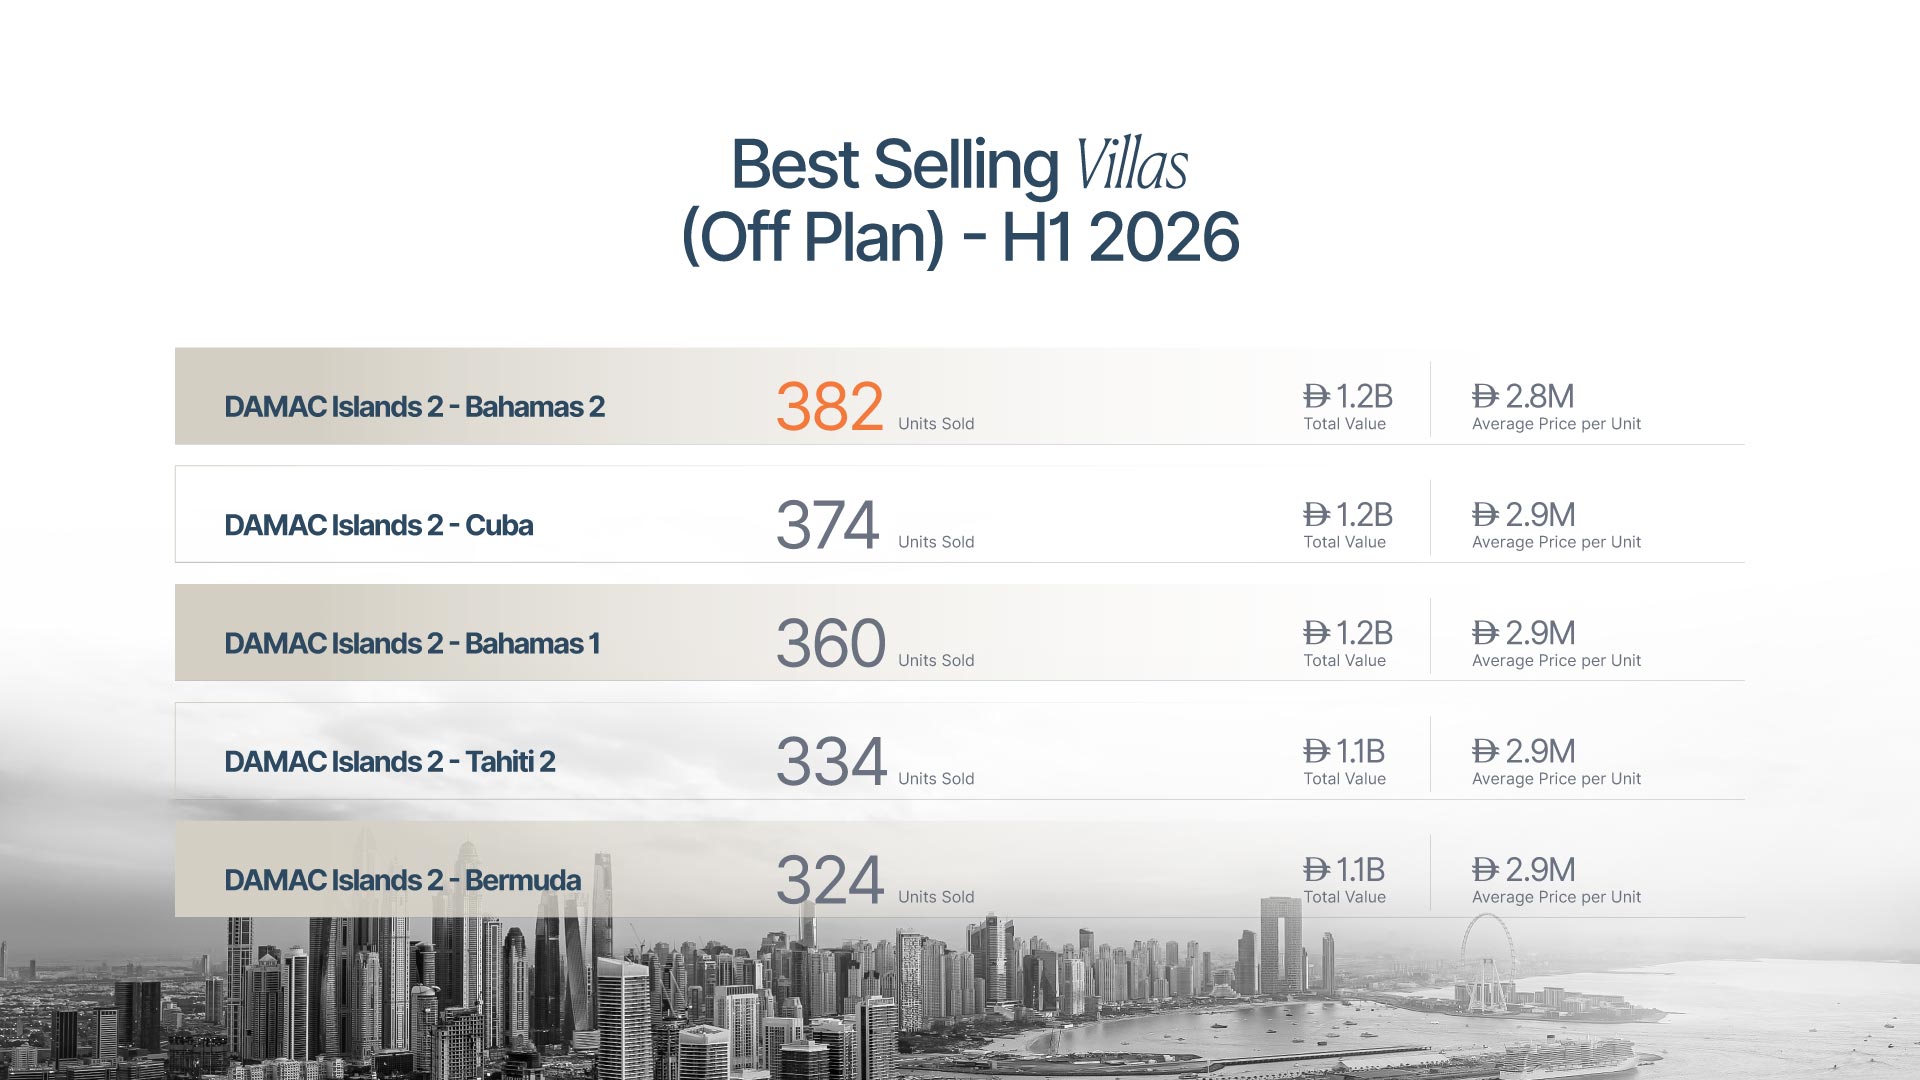
Off-plan villas recorded 6,015 transactions in H1 2026, generating AED 43B in total sales value at an average price of AED 4.1M per unit and AED 1,790 per sq. ft.
Despite representing a smaller share of transaction volume compared to apartments, off-plan villas accounted for a disproportionately large share of total sales value, reflecting the significantly higher price point at which villa buyers transact.
- Total Sold: 6,015
- Sales Value: AED 43B
- Average Price: AED 4.1M
- Average Price per sq. ft: AED 1,790
- Top Areas by Volume:
- Al Yelayiss 1: 47%
- Al Yelayiss 5: 12.4%
- Me’Aisem Second: 8.2%
- Dubai Investment Park Second: 5.6%
- Madinat Hind 4: 3.3%
Al Yelayiss 1 dominated off-plan villa transactions, accounting for 47% of the total volume. This is an unusually high concentration, suggesting a large-scale project launch or a phased release in the area driving the bulk of transactions.
Al Yelayiss 5 followed at 12.4%, suggesting that the broader Al Yelayiss corridor has emerged as the most sought-after community for off-plan villa buyers. Me'Aisem Second, Dubai Investment Park Second and Madinat Hind 4 rounded out the top five, all of which are established villa communities offering family-oriented living at competitive price points relative to more central locations.
Top Five Developers
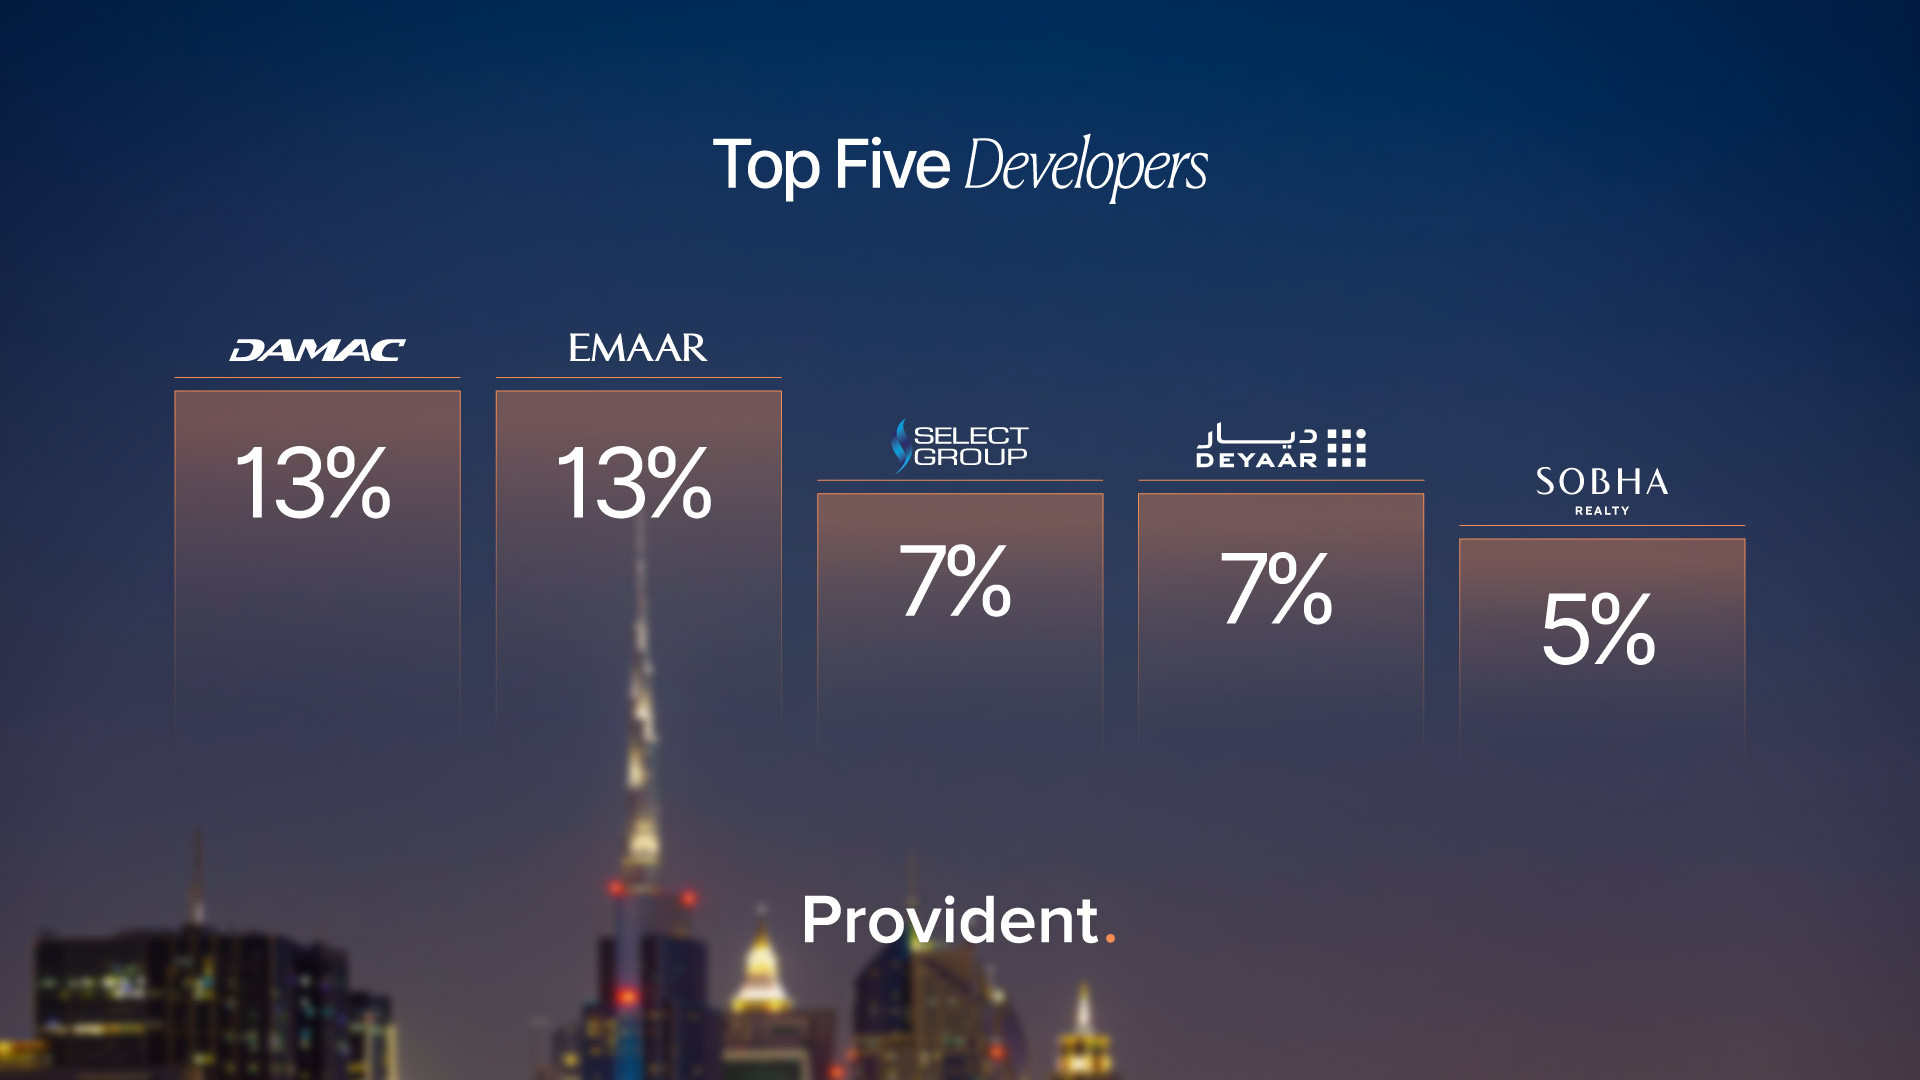
DAMAC and Emaar led developer activity in H1 2026, each accounting for 13% of total units delivered, followed by Select Group and Deyaar at 7% each and Sobha at 5%.
Together, these five developers were responsible for 45% of all residential units delivered in the first half of the year. The joint leadership position held by DAMAC and Emaar reflects the scale and depth of their active project pipelines across Dubai.
Both developers operate across multiple communities and price points simultaneously, which allows them to sustain high delivery volumes even as the broader market absorbs a growing number of new units.
Select Group, Deyaar and Sobha, while smaller in delivery share, maintain strong reputations in their respective segments and continue to attract consistent buyer demand across the Dubai real estate market.
Property Delivery Rate
Of all residential units due for handover in 2026, 21% had been delivered by the end of H1, with the remaining 79% classified as overdue.
Construction delays are a structural feature of Dubai's property market, driven by the sheer volume of simultaneous project activity, supply chain pressures and contractor capacity constraints.
Dubai Property Rental Market
Dubai's rental market recorded 169,439 contracts in H1 2026, a marginal 1% decline year-on-year. This reflects a market that is settling into a more stable phase following several years of strong upward movement. The one-bedroom unit remained the most popular choice among renters, accounting for 41% of all contracts recorded in the period.
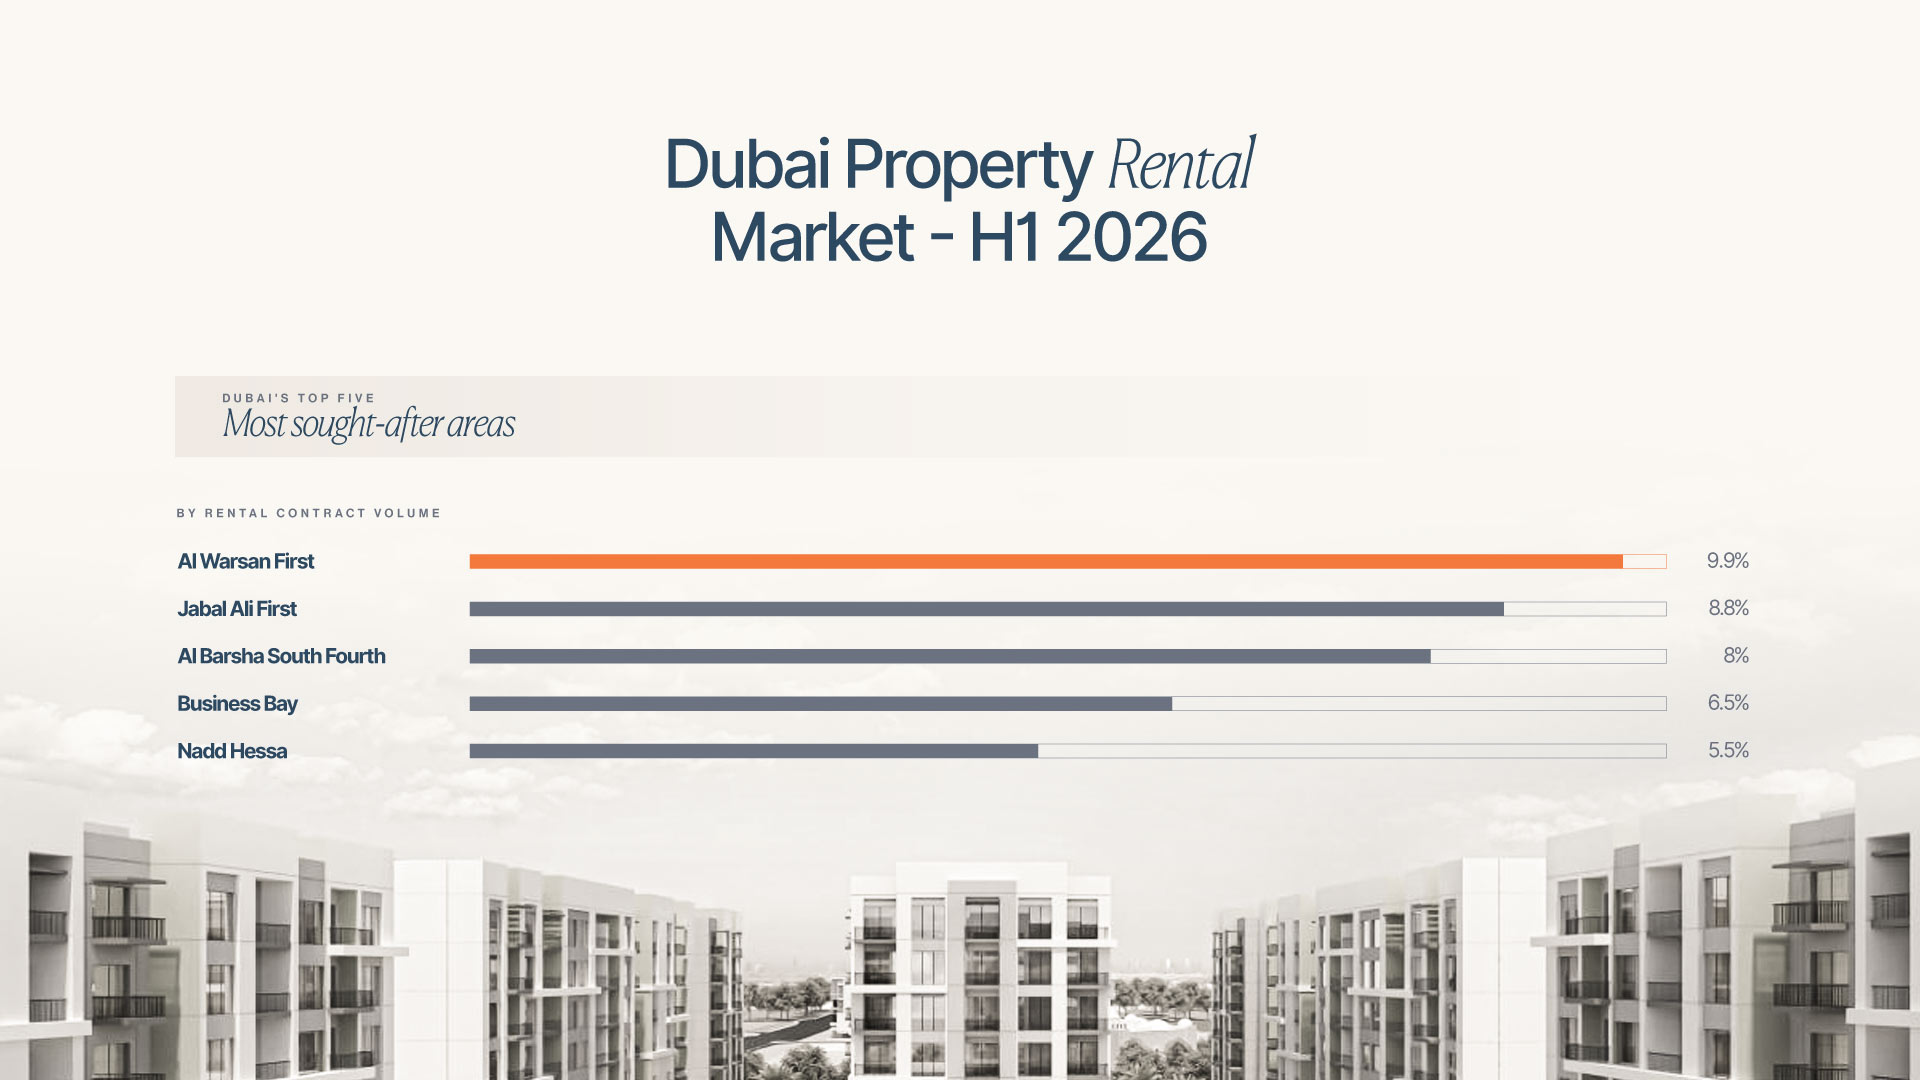
Dubai's top five most sought-after areas by rental contract volume in H1 2026 are:
For more information, get in touch with us at Provident